Area 01 // LLMsLesson 31 / 14013 min read
Benchmarks and model leaderboards
Benchmarks are standard test sets that score models on skills like knowledge, maths or coding, and leaderboards rank models by those scores or by human votes; they're useful for a shortlist, but only your own evals tell you which model is best for your product.
Think of it like this
Analogy
School exam results are a useful first filter when hiring: a top grade in maths says something real. But you'd never hire a chef based only on their chemistry exam. You'd ask them to cook your menu.
Benchmarks are the exam results of models. Your own evals are the cooking trial.
The problem it solves
Every model launch comes with a chart of benchmark scores, each lab claiming first place on something. The numbers use different settings, some tests have leaked into training data, and tiny differences get presented as big wins. Teams pick a model because it topped a leaderboard, then find it's worse on their actual task, or slower and three times the price.
You need to read benchmarks critically, use them to narrow choices, and then measure on your own work.
How it works, step by step
- A benchmark is a fixed test set plus a scoring rule. Common types:
- Knowledge and reasoning: multiple-choice exams across subjects (the MMLU family, GPQA-style expert questions).
- Maths: competition problems with checkable answers.
- Coding: tasks scored by running unit tests (SWE-bench-style real GitHub issues, LiveCodeBench-style fresh problems).
- Agents and tools: multi-step tasks in simulated environments (web, terminal, customer service).
- Long context, multilingual, safety, vision: specialised suites.
- A leaderboard ranks models, either by benchmark scores (e.g. Hugging Face's leaderboards, provider tables) or by human preference: people compare two anonymous answers and vote, producing Elo-style ratings (arena-style leaderboards such as LMArena).
- Read the fine print: number of questions, prompt format, number of attempts ("pass@1" vs best of many), whether tools or extra thinking were allowed, and who ran it.
- Check for problems:
- Data contamination: test questions in training data. Prefer benchmarks with fresh or private questions.
- Saturation: scores near the maximum stop separating models.
- Noise: small test sets have wide confidence intervals.
- Style bias: preference votes reward longer, friendlier answers.
- Use benchmarks to shortlist 2–4 models that are strong at the skill you need and within budget.
- Decide with your own evals: your real tasks, your prompts, your scoring, plus cost and latency (Area 4).
See it in code
- Needs
- Nothing: plain Python 3.
Is a 3-point lead real? With 200 questions, probably not. A quick confidence-interval check before you trust a gap.
import math

# Your own mini benchmark: 200 real questions, graded right/wrong.
results = {"model A": 164, "model B": 158}       # correct answers out of 200
n = 200

for name, correct in results.items():
    p = correct / n
    margin = 1.96 * math.sqrt(p * (1 - p) / n)  # 95% confidence interval (normal approx.)
    print(f"{name}: {p:.1%} ± {margin:.1%}  (somewhere between {p - margin:.1%} and {p + margin:.1%})")

gap = (results["model A"] - results["model B"]) / n
print(f"gap: {gap:.1%} -> the ranges overlap, so this test can't tell them apart.")
print("Need more questions, or a paired comparison on the same items, before choosing.")model A: 82.0% ± 5.3% (somewhere between 76.7% and 87.3%)
model B: 79.0% ± 5.6% (somewhere between 73.4% and 84.6%)
gap: 3.0% -> the ranges overlap, so this test can't tell them apart.
Need more questions, or a paired comparison on the same items, before choosing.The same logic applies to public leaderboards: a 1–2 point difference on a few hundred questions is usually within noise.
On the real platform
What this looks like in public leaderboards · See the real screen in the official docs
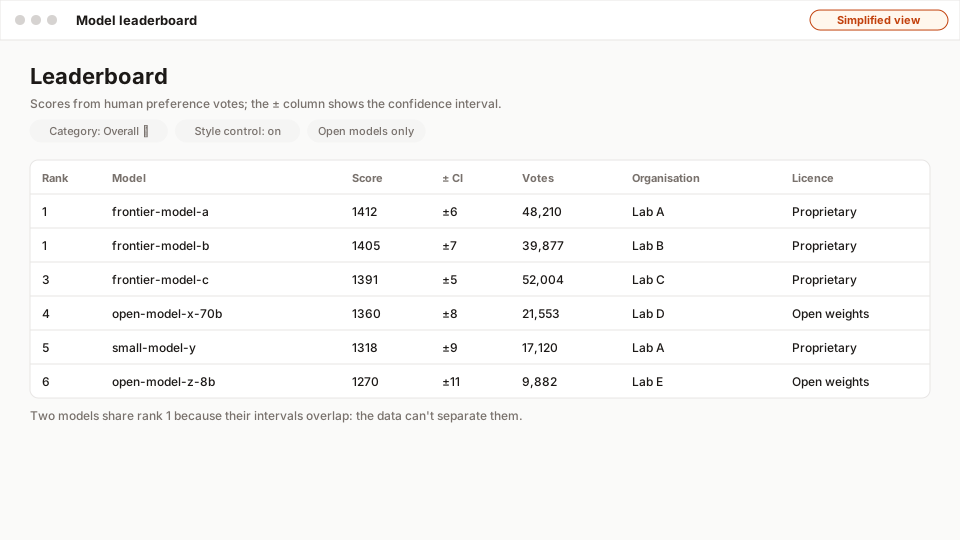
- 1Filters: category, style control and open models only.
- 2Shared ranks: the scores are too close to separate.
- 3The confidence interval: overlapping intervals mean 'tied'.
- 4Votes: more votes, tighter intervals.
- 5Licence: can you run it yourself?
Leaderboard sites change layout often, so here's what to look at on any of them:
- What's measured: the benchmark's description, number of items, and whether questions are public (contamination risk).
- Settings: shots, chain of thought or tools allowed, pass@1 vs pass@k.
- Date: when each model was scored; older scores may use older model versions.
- Confidence intervals or vote counts (for arena-style boards): a model with few votes has an uncertain rank.
- Filters: open vs closed, size, licence, price, so you only compare models you could actually use.
A real example
Example
The leaderboard winner that lost the bake-off
A fintech team shortlisted three models from leaderboards for summarising customer calls. The top-ranked model was 4 points ahead on a general reasoning benchmark. On their own 300 real call transcripts, scored by compliance officers against a rubric, the third-ranked model won: it was more faithful to the transcript and followed their summary template better, at half the price.
They kept the eval set and re-run it whenever a new model ships. Twice since, a "new #1" model has failed their bake-off.
The easy way
Start here
Use a leaderboard to pick 2–3 candidates that are good at your kind of task and affordable. Then write 50–100 real examples from your product, run all candidates, and compare. That small eval beats any public chart for your decision.
When you grow: the production setup
Teams maintain internal benchmark suites per product area, refreshed with new production cases, with statistical tests or paired comparisons for decisions, tracking quality, cost and latency together, and re-running automatically on every new model release and prompt change (regression evals in CI).
Trade-offs
What you gain
- Benchmarks give a quick, shared way to compare many models on specific skills.
- Human-preference leaderboards capture overall usefulness that fixed tests miss.
- Fresh and private benchmarks resist contamination and stay informative.
What it costs you
- Contamination, saturation and inconsistent settings make many scores misleading.
- They rarely match your data, format or quality bar.
- Labs optimise for popular benchmarks, which can inflate scores without real-world gains.
When not to use it
- Never use a leaderboard rank as the final decision for a production model; always confirm with your own evals.
Common mistakes
- Choosing a model by its rank on one leaderboard.
- Treating a 1–3 point difference as meaningful without checking sample size.
- Comparing scores measured with different settings (shots, tools, thinking).
- Ignoring cost and latency, which leaderboards often leave out.
- Never re-testing when a provider updates a model.
Interview questions
Try answering out loud first, then open the model answer.
How should you interpret LLM benchmark results?
Model answer
As rough, skill-specific signals. Check what's measured, item count, settings (shots, tools, reasoning, pass@k), who ran it and when, contamination risk, and whether the benchmark is saturated. Treat small gaps as noise unless confidence intervals separate. Use them to shortlist, then validate on task-specific evals with your prompts and data, alongside cost and latency.
What is benchmark contamination and how do people mitigate it?
Model answer
Contamination is when test items or close variants appear in training data, so scores reflect memorisation. Mitigations: held-out private test sets, regularly refreshed benchmarks with questions created after model cut-offs, canary strings, decontamination checks (n-gram overlap) and evaluating on perturbed versions of questions to see if performance holds.
How would you build an internal benchmark to choose a model?
Model answer
Collect representative real tasks (including hard and edge cases), define scoring (exact match, unit tests, rubric with an LLM judge calibrated to humans), freeze the set with versioning, run each candidate with production-like prompts multiple times, compute scores with confidence intervals or paired tests, and report quality alongside cost and latency per task. Keep refreshing the set from production failures.
Quiz
Pick an answer to see whether it’s right and why.
0 of 6 answered
Key terms
- Benchmark
- A fixed set of test tasks with a scoring method, used to compare models on a skill.
- Leaderboard
- A ranking of models by benchmark scores or by human preference votes.
- Data contamination
- When test questions appeared in a model's training data, making its benchmark score look better than its real ability.
- Confidence interval
- A range that likely contains the true value of a measured score. Small test sets give wide intervals, so small gaps may be noise.
- Eval
- A repeatable test of an AI system's quality on a set of examples with a scoring method.
Before and after
Progress is saved in this browser only.