Area 04 // EvalsLesson 75 / 14015 min read
Langfuse and observability dashboards
Langfuse is an open-source LLM engineering platform (tracing, prompt management, evaluation and dashboards) you can use in the cloud or self-host, and observability dashboards turn the traces it collects into the numbers you watch every day, such as volume, quality, latency, cost and errors.
Think of it like this
Analogy
A car's dashboard shows speed, fuel, engine temperature and warning lights at a glance, so you don't have to open the bonnet every few minutes. Behind it, sensors record everything; the mechanic can plug in and read the detailed log when something goes wrong.
Langfuse is both: the sensors and the detailed log (traces), and the dashboard (charts of cost, latency and quality).
The problem it solves
You've added tracing. Now you have thousands of traces a day, scattered eval scores, user feedback in another database, and prompts copy-pasted in code. Nobody can quickly answer "Did quality drop after Tuesday's prompt change?", "Which feature costs the most?", "Why are Spanish users unhappy?". You need one place where traces, scores, prompts and dashboards live together.
How it works: Langfuse
- Get a project: sign up for Langfuse Cloud, or self-host (open source; MIT licence except the enterprise
eefolders; a Docker Compose setup for small deployments). Create API keys. - Set environment variables:
LANGFUSE_PUBLIC_KEY,LANGFUSE_SECRET_KEY,LANGFUSE_BASE_URL. - Instrument with the Python SDK (v5 as of November 2026, built on OpenTelemetry):
@observe()on functions creates spans;@observe(as_type="generation")marks model calls; integrations for OpenAI, Anthropic, LangChain/LangGraph and others capture model calls automatically. - Add context:
propagate_attributes(user_id=..., session_id=..., metadata=...)so you can filter by user, conversation and version. - Attach scores: eval results and user feedback via
score_current_trace(...)orcreate_score(...)(numeric, categorical or boolean). - Use the platform:
- Tracing: view each trace as a tree, with inputs, outputs, tokens, cost and latency per step; group by sessions.
- Prompt management: store versioned prompts, fetch them at runtime, and see which version produced each trace (prompt versioning).
- Datasets and experiments: build golden datasets from traces and run evals against them.
- LLM-as-a-judge evaluators: configured in the UI to score traces automatically.
- Annotation queues: for human labeling.
- Dashboards: cost, latency, volume and scores over time.
- Flush at the end of short scripts (
get_client().flush()) so buffered data is sent.
How it works: observability dashboards
Observability dashboards turn traces into the few numbers you watch daily:
- Traffic: requests per minute or day, per feature.
- Reliability: error rate, timeouts, retries, fallback rate, guardrail blocks.
- Latency: p50, p95, p99 end to end, time to first token, per step (P95 latency).
- Cost: tokens and money per day, per model, per feature, per user or tenant (cost per request).
- Quality: judge scores, user feedback rate, escalation rate, per prompt version.
- Slices: filter all of the above by version, model, language, customer.
- Alerts: thresholds on error rate, p95, cost per hour and quality scores (alerts and dashboards).
See it in code
- Install
pip install langfuse anthropic- Needs
- A Langfuse project (cloud or self-hosted) with LANGFUSE_PUBLIC_KEY, LANGFUSE_SECRET_KEY, LANGFUSE_BASE_URL set, plus ANTHROPIC_API_KEY. SDK v5 as of November 2026.
Tracing a RAG request with nested spans, user and session attributes, and a score.
import anthropic
from langfuse import get_client, observe, propagate_attributes

client = anthropic.Anthropic()

@observe()                                         # a span for the retrieval step
def retrieve(question: str) -> list[str]:
    return ["Full-time employees get 25 days of annual leave."]

@observe(as_type="generation")                     # marks this span as a model call
def answer(question: str, sources: list[str]) -> str:
    msg = client.messages.create(
        model="claude-haiku-5-5", max_tokens=300,
        system="Answer only from the sources.",
        messages=[{"role": "user", "content": f"{sources}\n\nQuestion: {question}"}])
    return msg.content[0].text

@observe()                                         # the root span = the whole request
def handle(question: str, user_id: str, session_id: str) -> str:
    with propagate_attributes(user_id=user_id, session_id=session_id, metadata={"prompt": "v12"}):
        text = answer(question, retrieve(question))
        get_client().score_current_trace(name="has_citation", value=0)   # e.g. from a quick check
        return text

print(handle("How many leave days do I get?", user_id="u42", session_id="s-1001"))
get_client().flush() # send buffered spans before the script exitsFull-time employees get 25 days of annual leave.In the Langfuse UI this appears as one trace (handle) with two children (retrieve, answer), the model's token usage and cost on the generation, user u42, session s-1001, and a has_citation score of 0 you can filter on.
On the real platform
What this looks like in Langfuse · See the real screen in the official docs
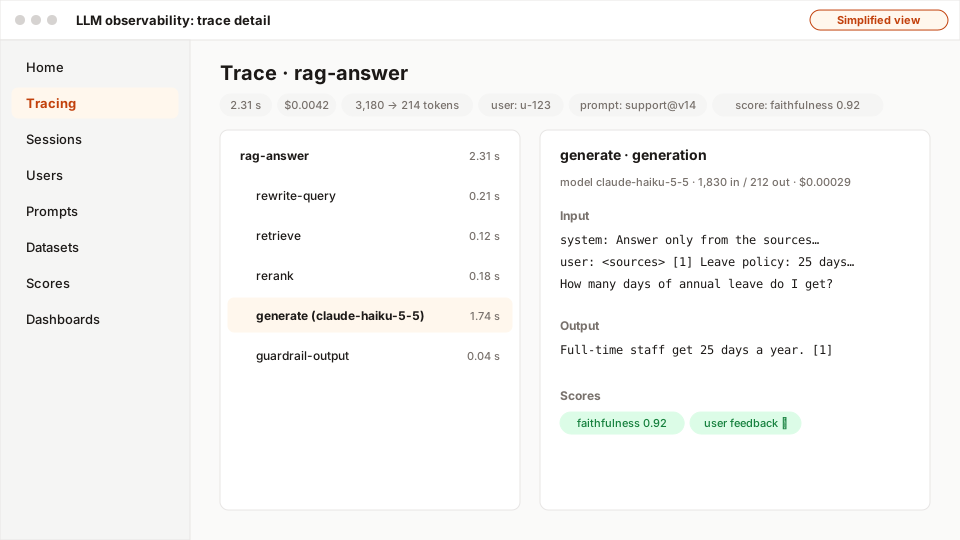
- 1Trace summary: latency, cost, tokens, user and prompt version.
- 2The span tree: rewrite, retrieve, rerank, generate, guardrail.
- 3The selected generation: model, tokens, cost, full input and output.
- 4Scores attached to the trace: evals and user feedback.
The Langfuse web app (cloud or self-hosted) is organised the same way in both:
- Tracing → Traces: a table of requests with latency, cost, tokens, user and scores. Filter by user, session, tag, version or score.
- Click a trace: the span tree on the left (root request, retrieval, generation), the selected span's input, output, model, tokens and cost on the right.
- Sessions: all traces of one conversation in order.
- Prompts: versioned prompts with labels such as
production; each trace links to the version used. - Datasets / Experiments: golden sets built from traces and the results of eval runs.
- Dashboards: cost, latency and score charts over time, sliceable by model, user and version.
A real example
Example
One dashboard, three fixes in a week
A team connected its assistant to Langfuse and built a dashboard. In the first week it showed: (1) one enterprise customer generated 40% of all cost because their documents produced huge contexts, fixed with better chunk limits; (2) p95 latency doubled every evening, traced to a provider rate limit causing retries, fixed with a fallback model; (3) the judge-scored "grounded" rate dropped from 94% to 81% the day a new prompt version was labelled production, so they rolled the label back to the previous version in two clicks.
The easy way
Start here
Create a free Langfuse Cloud project (or run it locally with Docker Compose), set the three environment variables, and add @observe() to your main function and model calls. Open the Traces page and click a trace. Then add one score (user thumbs) and one dashboard chart (cost per day).
When you grow: the production setup
Teams self-host or use the cloud with data-residency choices, instrument via OpenTelemetry, attach judge scores and feedback automatically, manage prompts with labels and rollbacks, build datasets from production traces, run experiments in CI, redact sensitive data, set retention policies, and alert on the dashboard metrics. Alternatives with similar features include LangSmith, Arize Phoenix, Braintrust and Helicone (eval tools).
Trade-offs
What you gain
- Traces, scores, prompts, datasets and dashboards in one place.
- Open source and self-hostable, or a managed cloud.
- OpenTelemetry-based, so it fits with other observability tools.
What it costs you
- Another system to run (if self-hosted) or a vendor to trust with data (if cloud).
- Trace volume and storage costs grow with traffic.
- Dashboards only help if someone watches them and alerts are tuned.
When not to use it
- Your company already runs a general observability stack with good GenAI support and you don't need prompt management or eval features; send OTel spans there instead.
Common mistakes
- Forgetting
flush()in short scripts, so traces never arrive. - Not attaching user, session and version, making dashboards impossible to slice.
- Sending sensitive data without redaction.
- Dashboards with dozens of charts and no alerts.
- Following an older SDK major version's tutorial with the v5 SDK.
Interview questions
Try answering out loud first, then open the model answer.
What does an LLM observability platform like Langfuse give you?
Model answer
Hierarchical traces of every request (inputs, outputs, retrieval, model calls with tokens and cost, tool calls, latency), sessions, scores from evals and user feedback attached to traces, versioned prompt management linked to traces, datasets and experiments for offline evals, LLM-as-a-judge and human annotation workflows, and dashboards and alerts on cost, latency, volume and quality, sliceable by user, model and version.
What would you put on an observability dashboard for an AI feature?
Model answer
Request volume; error, timeout, retry and fallback rates; p50/p95/p99 end-to-end latency and time to first token; tokens and cost per day, model, feature and tenant; quality scores (judge metrics, feedback, escalations) per prompt and model version; guardrail block rates. With filters for slices and alerts on thresholds.
Cloud or self-hosted observability for LLM traces?
Model answer
Cloud is faster to start and has no operations burden, but prompts and user data leave your infrastructure, subject to the vendor's security, residency and retention terms. Self-hosting keeps data in-house and can be required by policy, at the cost of running, scaling, upgrading and securing the platform. Redaction and sampling help either way.
Quiz
Pick an answer to see whether it’s right and why.
0 of 5 answered
Key terms
- Langfuse
- An open-source LLM engineering platform for tracing, evals, prompt management, datasets and dashboards; cloud or self-hosted.
- Observability dashboard
- Charts of the key health numbers of a system (traffic, errors, latency, cost, quality) built from traces, metrics and logs.
- Tracing
- Recording every step of a request (model calls, tool calls, retrieval) with timing, inputs and outputs, so you can debug and measure it.
- Prompt versioning
- Storing every prompt change as a numbered version, so you can review, test, deploy and roll back prompts like code.
- Eval
- A repeatable test of an AI system's quality on a set of examples with a scoring method.
Before and after
Progress is saved in this browser only.